Homes in Sydney typically spend several weeks to a couple of months on market before going under contract, though the exact figure swings widely by suburb, property type and sale method. There is no single citywide number worth memorising. What matters for anyone planning a purchase from overseas is knowing where to pull current suburb-level data and how to read it correctly, which is what the rest of this guide walks through.
TL;DR:
- Use median listing to contract days on market, and check the source’s definition, date range, and sales sample; small suburbs can swing sharply.
- Sydney winter, from June through August, is typically slowest; spring and autumn usually move faster, so compare a suburb’s figures with its seasonal pattern.
- Compare houses with houses and units with units, favor medians over means, and use a rolling average when monthly sales are sparse.
- US buyers should budget for remote inspections, negotiation, the conditional period, and New South Wales settlement, commonly negotiated at around six weeks.
- Treat a shift as meaningful only when it persists across multiple months; compare it with the suburb’s longer term trend and underlying sales volume.
Table of Contents
- What “days on market” actually measures
- Typical days-on-market ranges across Sydney suburbs
- Why the time of year changes how long a Sydney sale takes
- Where to find reliable suburb-level DOM data from the US
- Turning a suburb’s DOM figure into your buying timeline
- A buyers agent’s view on why DOM matters more than it looks
- How we help US buyers act on Sydney’s days-on-market data
- FAQ
- Useful sources for deeper research
What “days on market” actually measures
Days on market (DOM) measures the time between when a property is first listed for sale and when it goes under contract, though not every data source defines it the same way. Some portals track listing to contract date, others measure listing to settlement, and a few include withdrawn or relisted properties in a way that quietly inflates the average. The figure most commonly reported in Australian real estate data is listing to contract, since that reflects how long a genuine sales campaign ran before a buyer was secured.
A second distinction matters just as much: median versus mean. Median DOM takes the middle value in a set of sales, while mean DOM averages every sale together. Because a handful of properties can sit unsold for months and drag the average upward, median is the figure most analysts trust for a skewed dataset like residential sales.
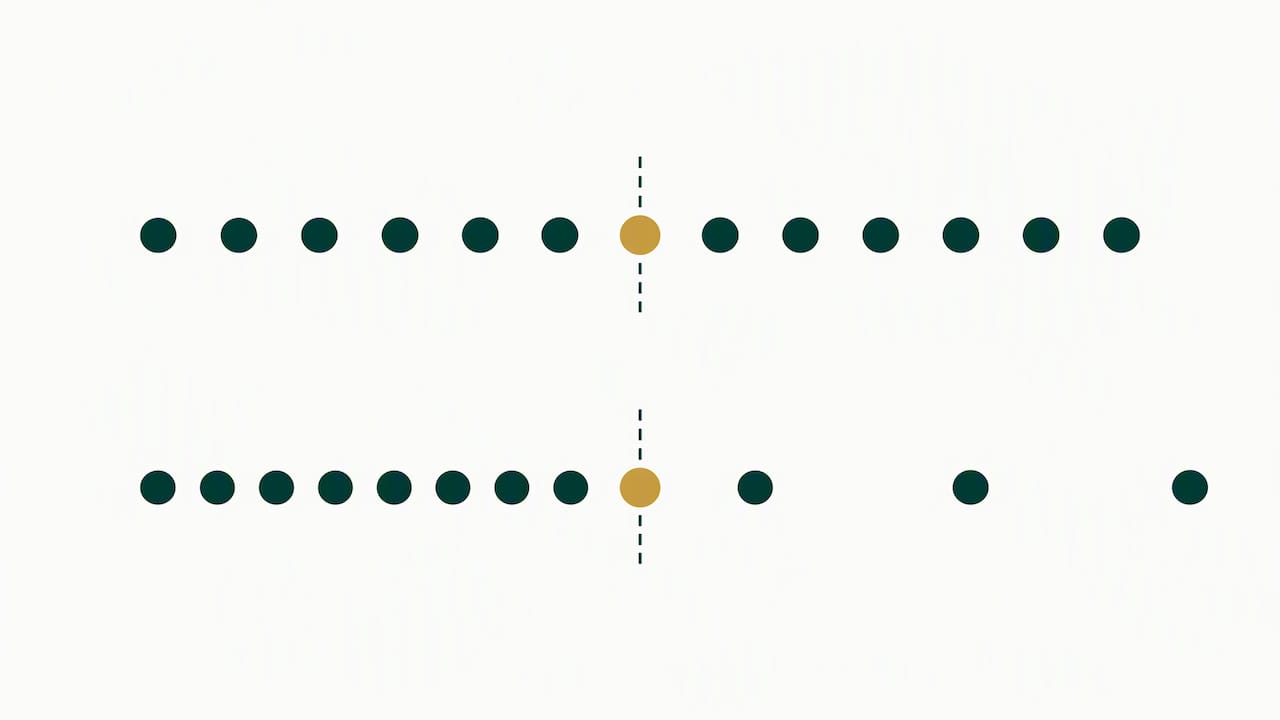
At suburb level, small sample sizes create real volatility. A suburb with only a small number of sales in a given month can show a median DOM that jumps sharply purely because one slow-moving property entered the mix, not because the market shifted.
Before trusting any suburb figure, check these basics:
- Confirm whether the metric is listing-to-contract or listing-to-settlement.
- Check whether the report uses median or mean DOM.
- Look at the sample size behind the figure, not just the headline number.
- Note the date range and whether it reflects the month of listing or the month of sale.
Skipping these checks is the most common reason researchers misread a suburb’s true selling speed.
Typical days-on-market ranges across Sydney suburbs
Sydney-wide DOM figures reported by major portals can vary with interest rates, seasonality and the specific month’s data pull, and any single suburb can sit well outside the citywide picture. Treat a citywide number as context rather than a forecast for the specific street you are researching.
Suburbs at the faster end tend to share a few traits: strong owner-occupier demand, limited supply, good transport links and a track record of high auction clearance rates. Inner Sydney pockets with consistent buyer competition can sell quickly when priced realistically. Suburbs at the slower end are usually fringe areas with lower turnover, a narrower buyer pool, or a recent run of overpriced listings that sat too long before a price correction.
Judging whether a change in a suburb’s reported DOM is meaningful takes more than eyeballing two numbers side by side. A small change in reported DOM may be noise. A larger shift that persists over consecutive months may point to something happening in that market, whether that is softer demand, a glut of listings, or pricing that has drifted above what buyers will pay.
A few practical thresholds help separate signal from noise:
- Treat a small change as potentially within normal monthly variation.
- Treat a substantial change that persists over multiple months as a possible shift worth investigating.
- Always check the number of sales behind a percentage change; a large jump based on very few sales may mean little.
- Compare the suburb’s figure against its own longer-term trend, not just last month’s number.
Small suburbs and quiet months are where this matters most. A suburb with few sales in a slow winter month can show a DOM figure that bounces around wildly from one month to the next, simply because the sample is too thin to be statistically stable. The same applies to new estates or pocket suburbs with fewer than a few hundred dwellings in total. Before reacting to a headline DOM figure for a suburb like this, check the underlying sales volume for that period and, where possible, look at a rolling average instead of a single month’s snapshot.
Why the time of year changes how long a Sydney sale takes
Seasonality has a measurable effect on how quickly Sydney properties sell, and the pattern runs opposite to what many US-based researchers expect because Sydney sits in the southern hemisphere. Winter in Sydney falls in June, July and August, and this is widely regarded as the slowest stretch for selling, with colder weather, shorter daylight hours and school holidays all cutting into open-home foot traffic. Spring, which runs September to November, and autumn, March to May, are generally the stronger selling seasons, bringing more listings, more competition among buyers and faster campaigns.
Beyond the calendar, several situational factors push DOM up or down regardless of season:
- Sale method: auction campaigns run on a set campaign timeline, while private treaty sales can drag on indefinitely if the price is wrong.
- Price bracket: entry-level and mid-market homes typically attract more buyers and sell faster than premium or unusual properties.
- Presentation and staging: a well-presented home photographs better and converts open-home attendance into offers more reliably.
- Marketing reach: a campaign limited to one portal or a short print run reaches fewer buyers than one with a proper digital and signage spread.
- Economic conditions and interest-rate sentiment: tighter lending conditions or rate uncertainty slow buyer decision-making across the board.
Distinguishing a genuine market shift from seasonal or random noise comes down to pattern and persistence. A single slow month during winter is expected. A suburb that stays slow through spring, when the rest of the market picks up, is telling you something different, possibly about pricing, stock levels or a change in buyer sentiment.
Pro tip: Smooth out seasonal noise by tracking a rolling average DOM for your target suburb rather than relying on any single month’s figure.
Where to find reliable suburb-level DOM data from the US
The most reliable starting points for suburb-level Sydney DOM figures are the major Australian property portals that publish suburb profile pages, alongside state property data services and specialist research houses that release downloadable datasets. These sources update more frequently than general news coverage and usually let you filter by property type and date range, which matters given everything covered above.
A practical verification checklist before you trust any figure:
- Confirm the date range covered by the report and whether it is current or several months old.
- Check which DOM definition the source uses: listing to contract, or listing to settlement.
- Filter results by property type so you are comparing houses with houses and units with units.
- Look for the underlying sample size, not just the headline median.
- Where the portal offers it, download the raw CSV data rather than relying on a summary chart.
A few interpretation habits will save you from reading too much into a single number:
- Favour median over mean DOM whenever both are available.
- Apply a rolling average to any suburb with few monthly sales.
- Never compare a house median against a unit median; the two markets can behave differently even within the same suburb.
Once you have a verified suburb figure, convert it into a practical planning number. A median DOM gives you the likely length of the active marketing campaign, but a full purchase timeline for a US-based buyer also needs to account for remote inspection scheduling, negotiation time, and the standard conditional period before a contract becomes unconditional. Our guide to researching Sydney suburbs walks through the other suburb metrics worth checking alongside DOM, and our explainer on why time on market matters for Sydney buyers in 2026 goes deeper on the negotiation implications.
Turning a suburb’s DOM figure into your buying timeline
A workable framework starts with the suburb’s median DOM, then layers on the practical realities of buying from the US:
- Start with the verified suburb median DOM as your baseline campaign length.
- Add a buffer for remote inspections, since you will likely need a local representative or agent to attend in person on your behalf.
- Add the standard conditional period (building and pest inspection, finance) before a contract becomes firm.
- Add settlement lead time, which in New South Wales is commonly negotiated at around six weeks from exchange.
A fast-moving inner suburb might translate to a lengthy period from active research to an unconditional contract once inspections, negotiation and conditions are factored in. A suburb with a longer median DOM could stretch the process further, particularly if you are also navigating auction cycles from a different time zone.
Pro tip: Build in extra slack around auction weekends and legal reviews, since coordinating inspections and contract checks across US and Sydney business hours often adds a few days that a same-city buyer wouldn’t need.
A buyers agent’s view on why DOM matters more than it looks
Days on market is one of the first numbers we check when setting a campaign plan, because it tells us how much runway to expect before serious competition shows up and how aggressive a bidding strategy needs to be at auction. A suburb running well below its usual median often signals a seller’s market where hesitation costs buyers the property.
A common misunderstanding among overseas buyers is treating Sydney’s auction calendar like a continuous process rather than a campaign leading to a single auction day. Another is assuming winter slowness in June and July means less competition, when it often just means fewer, more motivated buyers chasing the same well-priced homes.
Having someone track these figures and manage the campaign locally removes a layer of timing risk that is difficult to manage from another continent.
— Kristan
How we help US buyers act on Sydney’s days-on-market data
Reading suburb DOM data is only useful once it feeds into an actual purchase strategy, and that is where our Complete Purchase Solution comes in. We handle the full journey, strategy, on-market and off-market property search, independent appraisal, due diligence, negotiation and settlement, with purchases taking varying amounts of time from engagement to settlement, so the DOM research above turns into a concrete timeline rather than a guessing game.

If you have already found a property and just need representation at the table, our Negotiation Only service covers that specific stage. For auction campaigns, our Auction Bidding service puts an experienced bidder on the ground on sale day, which matters most in suburbs where DOM data shows a fast, competitive market.
- Complete Purchase Solution: full search, appraisal, negotiation and settlement support.
- Negotiation Only: representation once you have identified a property yourself.
- Auction Bidding: an experienced bidder on the ground for Saturday auctions.
Call us on 1800 676 177 or email hello@sydneypropertybuyers.com.au to talk through a target suburb and request an information pack before your next trip to Sydney.
FAQ
How big is the housing market in the US?
The US housing market is one of the largest in the world by total value and transaction volume, spanning many states with highly localised pricing and inventory conditions. Sydney’s market operates on different data standards and sale methods, including a far heavier reliance on auctions, so direct comparisons between the two markets need care.
Is house price growth slowing in Sydney?
Sydney price growth moves in cycles tied to interest rates, lending conditions and buyer sentiment, and it has both accelerated and cooled at different points in recent years. Checking current suburb-level price and DOM data together gives a more accurate read than relying on general headlines.
What is the 3-3-3 rule in real estate?
In high-price, low-yield markets like Sydney, the rent relative to mortgage costs is often difficult to achieve in practice, so it works better as a general reference point than a strict target.
What is the hardest month to sell a house in Sydney?
June and July are widely considered the hardest months to sell in Sydney, since colder weather, shorter daylight hours and school holidays reduce open-home foot traffic. Spring and autumn campaigns typically move faster, which is worth factoring into any timeline built around a specific suburb’s DOM figure.
Useful sources for deeper research
For hands-on help converting these figures into a workable campaign, see our negotiation strategy guide and our guide for US buyers on off-market and auction wins, plus the home presentation guide for context on why some listings linger.
Recommended
- How to research Sydney suburbs property in 2026
- Why time on market matters for Sydney buyers in 2026
- 10 Sydney Suburbs Poised for 2026 Growth: US Investor Playbook
- 10 Sydney Suburbs With Strong 2026 Growth for US Investors