Choosing the wrong Sydney suburb is an expensive mistake, and the data available to most buyers makes it surprisingly easy to get wrong. Whether you want to buy property in Sydney suburbs for the first time or you are building an investment portfolio, the property market Sydney suburbs presents is vast, varied, and full of micro-location traps that aggregate statistics simply cannot capture. This guide walks you through a practical, data-driven method to research Sydney suburbs property with confidence, covering price data, rental indicators, hidden costs, and the on-the-ground checks that separate good decisions from costly ones.
Table of Contents
- Key takeaways
- Researching Sydney suburbs property: where to start with price data
- Reading rental market signals for investment decisions
- Amenities and micro-location factors that shift values
- Budgeting for hidden costs and transaction timing
- Cross-checking your research before you commit
- My honest take on Sydney suburb research
- How Sydney Property Buyers can help you get this right
- FAQ
Key takeaways
| Point | Details |
|---|---|
| Use consistent data windows | Always compare median prices from the same 12-month period to avoid ranking suburbs incorrectly. |
| Vacancy rates signal more than supply | A 1.3% Sydney vacancy rate points to tenant stress, not just tight supply, which affects yield forecasts. |
| Micro-location matters within suburbs | Street tree distance, school proximity, and transport access can shift a property’s value by tens of thousands. |
| Budget beyond the purchase price | NSW stamp duty and transaction costs must be modelled upfront to avoid cashflow surprises at settlement. |
| Cross-check before committing | Verify suburb medians against comparable sales on the same street and property type before drawing conclusions. |
Researching Sydney suburbs property: where to start with price data
The first trap most buyers fall into is comparing suburb medians that come from different time periods. A figure pulled from one source covering the past six months and another covering the past two years are not comparable, yet this happens constantly in casual research. The Carto Australia map uses a fixed 12-month window from April 2025 to April 2026 for median house prices across Sydney suburbs, which makes it one of the more reliable starting points for like-for-like comparisons.
When you compare Sydney suburbs property values, you also need to separate house medians from unit medians. These tell very different stories. A suburb with a $1.4 million house median and a $650,000 unit median is not a uniform market. It is two markets sitting on top of each other, with different buyer profiles, different yield dynamics, and different growth trajectories. Treating the suburb as a single number is where a lot of investors go wrong.
Here is a practical framework for collecting price data:
- Pull median house and unit prices from a single source using the same date window
- Note the number of sales in the period. Fewer than 20 transactions makes a median statistically unreliable
- Record the year-on-year change, not just the current figure
- Cross-reference with at least one secondary source to check for outliers
The table below illustrates how this comparison might look across a small selection of Inner West and Eastern suburbs:
| Suburb | Median house price | Median unit price | Annual sales volume |
|---|---|---|---|
| Campsie | ~$1.83m | ~$680k | Moderate |
| Canterbury | ~$1.99m | ~$710k | Moderate |
| Marrickville | ~$1.85m | ~$750k | High |
| Randwick | ~$3.1m | ~$900k | High |
These figures are illustrative of the kind of spread you will find when you start to compare Sydney suburbs property values across different rings from the CBD.
Pro Tip: When you find a suburb with a compelling median price, check how many sales occurred in that period. A suburb with only eight sales in 12 months can have its median skewed by a single unusual transaction.
Reading rental market signals for investment decisions
If you are buying for investment, vacancy rates are one of the most telling indicators of suburb health. Sydney’s residential vacancy rate sat at 1.3% in April 2026, up slightly from 1.1% in March. That small rise matters less than what is driving it.
When vacancy rises but rents are also rising, you are not looking at oversupply. You are looking at tenant stress. Sydney’s house asking rent averaged $1,156.97 per week in April 2026, a figure that has pushed many tenants into sharing arrangements or forced them to relocate to cheaper suburbs. That dynamic compresses demand in premium areas and redirects it to middle-ring suburbs, which is exactly the kind of shift that creates investment opportunity if you are watching the right indicators.
For practical Sydney suburb property research on the rental side, focus on these signals:
- Vacancy rate trend over 6 months, not just the current snapshot. A rate moving from 2.1% to 1.3% tells a very different story than one moving from 0.8% to 1.3%.
- Asking rent trajectory. Flat rents in a low-vacancy suburb may indicate a ceiling has been reached, which limits yield growth.
- Tenant affordability pressure. In suburbs where rents are already at the upper limit of what local incomes support, vacancy rises do not necessarily signal weakening demand. They often signal tenants consolidating households.
Pairing vacancy data with rent growth and realistic lease-up assumptions gives you a far more grounded cashflow forecast than vacancy rates alone. Tools like SQM Research publish suburb-level data that can be filtered by property type, which makes this analysis considerably more precise.
Amenities and micro-location factors that shift values
Suburb-wide averages hide the most interesting property value story, which plays out at street level. Two properties 400 metres apart in the same suburb can differ by $200,000 or more, and the reasons are often measurable rather than subjective.
Street trees are a striking example. Research from the University of Technology Sydney found that trees 10 to 20 metres away add approximately $30,310 to a Sydney property’s value, while trees within 10 metres reduce value by nearly $70,290. The difference between a value boost and a significant loss is a matter of metres. This is not a soft amenity consideration. It is a quantifiable price variable that most buyers completely overlook.
Beyond trees, the micro-location factors worth assessing include:
- School catchment boundaries. Being 200 metres inside a sought-after public school zone versus just outside it can affect resale value materially.
- Transport access. Walking distance to a train station carries more weight than suburb-level proximity. A 400-metre walk to a station is meaningfully different from a 1.2-kilometre walk.
- Street orientation and noise. A rear-lane backing onto a busy arterial road affects liveability and resale in ways that do not show up in suburb medians.
- Safety and street activation. Foot traffic, lighting, and the mix of uses on a street all influence how quickly a property sells and at what price.
The ABC News analysis on street tree impact reinforces that amenity must be treated as a measurable variable, not a vague impression. When you visit a property, treat the street itself as part of the asset you are assessing.
Pro Tip: On your inspection visit, walk the block in both directions and note what is within a 5-minute walk. Then check Google Street View from 12 months ago to see whether the streetscape has changed. Development nearby can shift the micro-location picture quickly.
Budgeting for hidden costs and transaction timing
The purchase price is not what you pay. In New South Wales, stamp duty rules and timing mean that transfer duty is typically payable within three months of signing contracts, which creates a cashflow pressure point that many buyers underestimate when planning their finances.
Stamp duty in NSW operates on tiered rates. For a property at $2 million, the duty alone runs into the tens of thousands of dollars. First home buyers purchasing under $800,000 qualify for a full exemption, and there are concessions up to $1 million, but above those thresholds the full tiered rate applies. Understanding this before you set your search budget is not optional. It is the difference between a purchase that works financially and one that stretches you dangerously thin.
The full cost picture for a Sydney property purchase typically includes:
- Transfer duty (stamp duty) calculated on the contract price
- Conveyancing and legal fees (typically $1,500 to $3,500)
- Building and pest inspection reports ($400 to $800 per property inspected)
- Mortgage registration and lender fees
- Strata report if purchasing a unit or townhouse
The Sydney Property Buyers process page walks through how these costs layer together across the purchase timeline, which is worth reviewing before you finalise your borrowing capacity with a lender.
Cross-checking your research before you commit
All the data you have gathered means very little if you have not verified it against ground-level evidence. This is where Sydney suburb property research either pays off or falls apart.
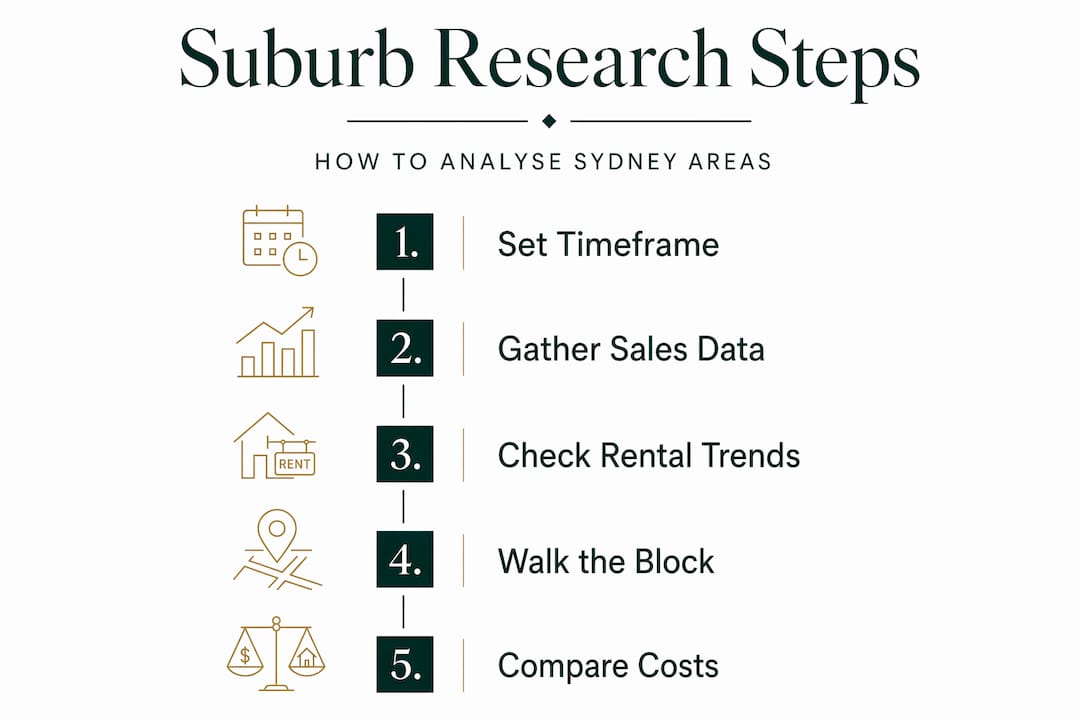
Follow this sequence when verifying your suburb shortlist:
- Confirm data periods match. If you are comparing three suburbs, check that every median price figure comes from the same 12-month window. The Carto Australia verification approach of using a fixed annual period is the standard you should apply across all your sources.
- Pull comparable sales on the same street. A suburb median tells you the middle of the market. A comparable sale on the same street, for the same property type and configuration, tells you what your specific target is actually worth.
- Check transaction volume. Low-volume suburbs require extra caution. Canterbury and Campsie, identified as potentially undervalued with medians around $1.83m to $1.99m, still require verification through comparable sales before you treat those figures as reliable benchmarks.
- Look for recency in the comparables. A sale from 18 months ago in a moving market is not a reliable anchor. Prioritise sales from the last three to six months.
- Investigate ‘undervalued’ claims carefully. A suburb that looks cheap relative to its neighbours may have a structural reason for the discount, whether that is flood risk, planned infrastructure, or demographic change.
The comparison below shows how two seemingly similar suburbs can diverge significantly once you look beyond the headline median:
| Factor | Suburb A | Suburb B |
|---|---|---|
| Median house price | $1.85m | $1.83m |
| Annual sales volume | 85 | 22 |
| School catchment quality | High-demand zone | Average zone |
| Train station walk | 6 minutes | 18 minutes |
| Data period confirmed | Yes | No |
Suburb B looks cheaper on price, but the lower transaction volume makes the median less reliable, and the micro-location factors suggest the discount is structural rather than an opportunity.
My honest take on Sydney suburb research
I’ve worked with buyers across the Inner West, Eastern Suburbs, and Lower North Shore for long enough to know that the biggest mistakes rarely come from choosing the wrong suburb entirely. They come from misreading the data within a suburb they have already correctly identified.
I’ve seen clients fall in love with a street that looked perfect on paper, only to discover during the inspection walk that the property sat directly under a flight path corridor that the suburb median had quietly absorbed. I’ve also seen buyers dismiss suburbs like Campsie or Marrickville because the median felt high relative to their expectations, without realising that the unit market in those suburbs was still accessible and showing strong rental demand.
What I’ve learned is that the research process needs two layers. The first is quantitative: consistent data windows, vacancy trends, comparable sales, and full cost modelling. The second is qualitative: walking the street, talking to locals, understanding why a property is priced where it is. Neither layer alone is enough. The buyers who get the best outcomes are the ones who treat every suburb visit as a data collection exercise, not just an emotional experience.
The real estate Sydney suburbs market rewards preparation. It does not reward speed or gut feeling alone.
— Kristan
How Sydney Property Buyers can help you get this right
Doing this research thoroughly takes time, access to the right data tools, and experience interpreting what the numbers actually mean in context. That is exactly what Sydney Property Buyers provides across the Sydney City Ring, within 15 kilometres of the CBD.

Whether you are looking at the Inner West, the Eastern Suburbs, the Lower North Shore, or the Eastern Beaches, Sydney Property Buyers brings suburb-level data analysis, micro-location assessment, and experienced negotiation to every purchase. The goal is not just to find you a property. It is to find you the right one, at the right price, with no costly surprises at settlement. Explore the full range of buyer agent services or get in touch directly to discuss your search.
FAQ
How do I compare Sydney suburbs property values accurately?
Use median price data from the same fixed 12-month period across all suburbs you are comparing. The Carto Australia map applies a consistent annual window, which reduces the risk of ranking suburbs based on mismatched timeframes.
What vacancy rate signals a good investment suburb in Sydney?
A vacancy rate below 2% generally indicates strong rental demand. Sydney’s rate of 1.3% in April 2026 points to a tight market, but pair this with rent trajectory data to assess whether yields have room to grow or have already plateaued.
What are the cheapest suburbs in Sydney worth researching in 2026?
Suburbs like Campsie (median around $1.83m) and Canterbury (around $1.99m) have been identified as potentially undervalued relative to nearby areas, but always verify with comparable sales and check transaction volume before treating the median as reliable.
How much does stamp duty add to a Sydney property purchase?
Stamp duty in NSW is tiered and typically payable within three months of signing contracts. On a $2 million purchase, it adds a significant five-figure sum. First home buyers are exempt below $800,000, with concessions up to $1 million.
Do micro-location factors really affect property values within a suburb?
Yes, and the effects are measurable. Research shows that street trees 10 to 20 metres from a property can add around $30,000 in value, while trees within 10 metres can reduce value by nearly $70,000. School catchments, transport walking distance, and street orientation all produce similarly quantifiable differences.
Recommended
- Buyers Agent Inner West Sydney | Sydney Property Buyers
- Buyers Agent Eastern Suburbs Sydney | Sydney Property Buyers
- Buyers Agent Lower North Shore Sydney | Sydney Property Buyers
- Buyers Agent Eastern Beaches Sydney | Sydney Property Buyers
Article generated by BabyLoveGrowth